 In recent years a series of storms have swept across Europe. The list comprises some prominent storms in Germany like hurricane Niklas (2015), storm Xavier (2017), hurricane Friederike (2018), hurricane Sabine, and storm Victoria (both in 2020). During the last hurricane named Sabine, winds reached speeds of up to 177 km/h. Even in the lowlands, speeds of around 150 km/h could still be measured. This is a good enough reason for us to take a closer look at the calculation of PV systems. Because one thing is for certain – there will be more hurricanes on the way!
When calculating rooftop PV systems, it is very important to determine the appropriate parameters. According to the DIN EN 1991-1-4 standard, the wind zone, terrain category and building height for example must be taken into account. As a result, the gust velocity pressure or the wind gust speed can be determined. In this way, an appropriate and correct dimensioning of the mounting system with correct fastening points is achieved. Moreover, there are additional factors to reduce the gust velocity pressure (gust wind speed) and the snow load. These are the so-called categories of consequential damage and the lifespan of a PV system.
What does damage classification mean?
According to the standard DIN EN 1990: 2010-12, there are three categories for the classification of damage as shown in Table B.1.
The lowest damage classification is CC1,which is used when damage is expected to have a low impact on human life and small or negligible economic, social and environmental consequences. Examples are agricultural buildings without regular passenger transport (e.g. barns, greenhouses). In these cases the value of the gust velocity pressure can and will be reduced by 10 percent.
The next damage classification is CC2. This applies if, in the event of damage, medium level risks to human life, or major economic, social or environmentally damaging impacts are to be expected. Examples are residential and office buildings, and public buildings with medium failure consequences. In practice, this case should and will most frequently be used. In this category it is not possible to reduce the gust velocity pressure.
The highest classification is CC3 which has to be used if, in the event of damage, high risks to human life or very large economic, social or environmental impacts are to be expected. Examples are grandstands or public buildings with high failure consequences, such as concert halls. In contrast to the two previous scenarios, the value of the gust velocity pressure in these cases is increased by 10 percent.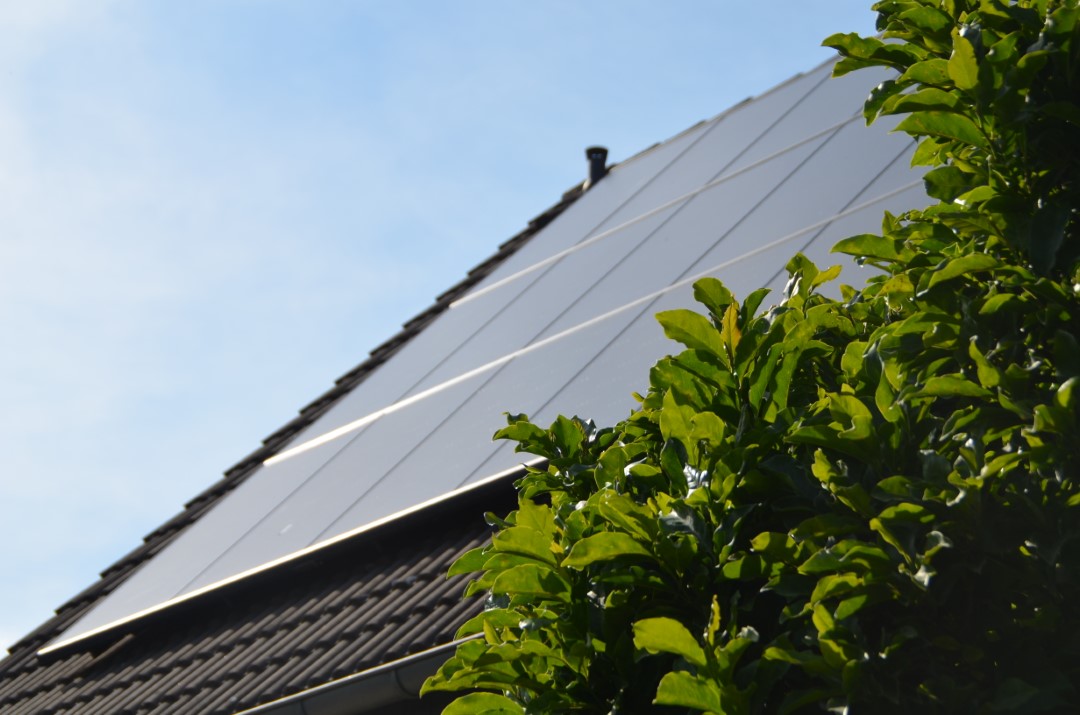
However, our research did not show a single case in which the highest classification CC3 was applied. In fact, the category that is used most is CC1 which means that the loads are reduced by 10%.
What is meant by lifespan?
In structural calculations in building construction, a building is usually attributed a service life of 50 years. However, there are also structures (so-called flying structures) that are only designed for a short construction time or lifespan. These include buildings that are designed to have a service life of up to 25 years. In these cases the wind speeds can be reduced by about 10 percent.
If this starting point is now applied to a photovoltaic system that is classified as having a service life of between 20 years and 25 years, the second scenario is used and a corresponding percentage reduction in wind speeds is calculated. This approach is controversial, since a PV system is always connected to the structure of the building. Due to the 25-year rating, the life expectancy of the roof covering is automatically reduced, although this – as part of a building – is in the first category mentioned above with a life expectancy of 50 years.
If the respective reductions of 10 percent are now added together from the damage consequence class and service life, the following formula is used to reduce the gust pressure: 0.9 x 0.9 = 0.81 => ca. 20 %
Sample calculation
If we take, for example, a building with a height of 10 meters, which is located in wind zone 1 and is on the edge of a residential or industrial area (terrain category II), we get a general gust velocity pressure of 0.664 kN/m². This corresponds to a wind speed of approx. 117 km/h.
If we now reduce this wind speed by the specific damage classification and lifespan, we obtain the following value: 117 km/h x 0.9 x 0.9 = 95 km/h. This corresponds to a wind speed reduction of 22 km/h.
If we now change the terrain category from II to III in the example listed above, the wind speed to be applied according to the standard for the same building is only approx. 102 km/h. If you then reduce the wind speed for this scenario with the factors mentioned above, the following value applies: 102 km / h x 0.39 x 0.9 = 82 km/h. In this example calculation, the wind speed would already be reduced by approx. 35 km/h.
The facts

The lower the calculated wind speed for the building, the cheaper the PV system will be, as fewer components in the form of mounting points are required. In our example calculation, just by specifying a different building category, you get a value difference in the wind speed of 35km/h. This is problematic because many people only consider the cost factor and often underestimate the dimensions and forces of hurricanes. Thus, it happens again and again that gaps are found in the calculation system with building categories or other data in order to obtain a PV system that is as cost-effective as possible. This is quite dangerous and can have fatal consequences under certain circumstances. This is because the storm depressions of recent years have reached wind speeds of between 130 – 150 km/h even in the lowlands – a force that should definitely not be underestimated.